
Landing page clarity audit: a 30-minute founder checklist
You cannot read your own page as a stranger does. This is a repeatable audit, with a scoring rubric and test scripts, for founders who suspect their landing page is clear only to them.
By the SitePatent Editorial Team. Published , revised . 19 minute read, 14 sources.
The short answer
How do you check whether a landing page is clear?
Show the first screen to people who have never seen it, for five seconds, then ask what the product is, who it is for and what they would do next. Score the page against a fixed rubric using their answers, not your own opinion. Fix the lowest-scoring items in the first screen, starting with the headline, then test again with new people.
- Time needed
- 30 minutes, plus a 1-hour follow-up
- Cost
- Free
- You need
- 5 strangers and 2 screenshots
- Best for
- Pages with traffic but few signups
What you will leave with
- Why the first screen carries most of the weight: in NN/g eye tracking published in 2018, 57% of viewing time went above the fold.[3]
- A 10-criterion rubric, scored 0 to 2 each, that turns "is my page clear?" into a number you can compare between versions.
- A script for a 5-second test, including the three questions to ask and the one thing not to tell participants.
- What "test with 5 users" does and does not prove, in the words of the research that the rule comes from.
- Which fix belongs to which symptom, so you do not redesign the page when the button label was the problem.
What is a landing page clarity audit?
It is a short, repeatable check of one thing: whether a stranger can say what the product is, who it is for and what to do next after a few seconds on your first screen.
You know what your product does, so every sentence on your page looks complete to you. A visitor has none of that context. The audit replaces your judgement with the answers of people who have never seen the page, and with a rubric that stays the same from one version to the next.
- How soon users often leave a web page, per Jakob Nielsen (2011)[1]
- 10-20 s
- The most of a page's words users have time to read on an average visit; 20% is more likely (2008 estimate)[2]
- 28%
- Share of page-viewing time spent above the fold in NN/g eye tracking (2018)[3]
- 57%
- Test users who always scanned any new page instead of reading it (1997)[4]
- 79%
The vocabulary
- Above the fold
- What is visible before any scrolling. It differs by device, so check a laptop and a phone.
- 5-second test
- A first-impression test: you show a design for five seconds, hide it, then ask what people took from it.[8]
- Hallway test
- Informal usability testing with whoever is nearby. Joel Spolsky, who put it on his 2000 checklist for software teams, describes grabbing "the next person that passes by in the hallway".[14] For this audit, pick people outside the project.
How do visitors actually read a landing page?
They scan, mostly at the top, and they decide quickly. The research is consistent on the direction even where the individual studies are old.
In 2011 Jakob Nielsen summarised a Microsoft Research analysis of 205,873 web pages and more than 2 billion dwell times. His reading of it: the first 10 seconds of a visit are critical to the decision to stay or leave, and visitors remain highly likely to leave during the next 20 seconds. The leaving rate only flattens after about 30 seconds.[1]
Reading is partial. Working from 45,237 page views recorded from 25 highly literate users, Nielsen estimated in 2008 that visitors spend about 4.4 extra seconds for each additional 100 words on a page, enough to read roughly 18% of the added text.[2] Adding a paragraph does not mean it gets read.
To gain several minutes of user attention, you must clearly communicate your value proposition within 10 seconds.
Figure 1Where page-viewing time goes, by scroll depth
- First screenful (above the fold)57%
- Second screenful17%
- Everything further down26%
When a page gives the eye nothing to hold on to, people fall into what NN/g calls the F-shaped pattern: a read across the top, a shorter read across lower down, then a scan down the left edge. NN/g describes it as the default "when there are no strong cues to attract the eyes towards meaningful information".[5] The words on the right of your third line may never be seen. NN/g's remedies are plain: put the most important points first, use headings that start with information-carrying words, and cut unnecessary content.[5]
What must a visitor see before scrolling?
Five things: a headline that says what it is, a subhead that says who it is for and how, one primary action, one piece of proof and a view of the real product.
Figure 2The above-the-fold contract: five elements and the question each one answers
| Element | Question it answers | Fails when |
|---|---|---|
| Headline | Question it answersWhat is this? | Fails whenIt would still be true on a competitor's page, or on a page for a different kind of product. |
| Subhead | Question it answersWho is it for, and how does it work? | Fails whenIt repeats the headline in different adjectives. |
| Primary action | Question it answersWhat do I do next, and what happens when I click? | Fails whenThe label is generic, or two buttons compete at equal weight. |
| Proof | Question it answersWhy should I believe it? | Fails whenIt is a claim about yourself ("trusted by teams") with nothing a visitor can check. |
| Product visual | Question it answersWhat does it look like in use? | Fails whenIt is an abstract illustration, or a screenshot too small to read. |
The same NN/g guidance asks a homepage to offer clear starting points for the main 1 to 4 tasks a visitor has.[9] A landing page is narrower than a homepage, so in our view it should carry one. Every extra equal-weight button is a decision you hand to someone who has not yet decided to stay.
Proof is the element founders most often leave out. Which signals count, and how to collect honest reviews, are covered in the separate guides on startup trust signals and on first customer testimonials. For this audit you only check that one verifiable piece of proof is visible without scrolling.
How do you rewrite a vague headline?
Replace the abstraction with three concrete things: the category of product, the person it is for and the result they get. If a stranger could not draw a rough picture of the product from the headline and subhead, it is still vague.
Vague hero copy
- "The future of work, reimagined."
- "Unlock your team's full potential with our AI-powered platform."
- "Seamless. Powerful. Simple."
- Button: "Get started"
Clear hero copy
- "Shared inbox for support teams of 2 to 10."
- "Turn customer call recordings into a searchable list of feature requests."
- "Send invoices from your phone. Get paid by card or bank transfer."
- Button: "Start a free 14-day trial"
The call: Every example here is invented for illustration and describes no real product. The vague lines could sit on thousands of pages; each clear line can only describe one kind of product.
Headline and subhead formula
Fill the brackets, then cut any word a customer would not use when describing the problem to a friend.
HEADLINE (aim for 12 words or fewer)
[Product category] for [specific audience] that [concrete result].

SUBHEAD (one or two sentences)
[How it works in plain words], so you can [what they stop doing or start getting]. [One fact that makes it believable: setup time, integration, or number].

BUTTON
[Verb] + [what they get] (for example: Start a free trial / See a sample report / Join the waitlist)

CHECK
- Could a competitor paste this headline onto their page unchanged? If yes, rewrite.
- Is there a noun a twelve-year-old could not picture? Replace it.
- Does the button say what happens after the click?
Figure 3Before and after: hero headlines for four invented example products
| Example product (invented) | Before | After | What changed |
|---|---|---|---|
| Scheduling tool for dog groomers | Before"Grow your business effortlessly" | After"Online booking for dog groomers, with automatic reminders" | What changedNamed the category and the audience. |
| API uptime monitor | Before"Reliability you can trust" | After"Get a text within 60 seconds when your API goes down" | What changedSwapped a virtue for an observable event. |
| AI meeting notes tool | Before"Supercharge every conversation" | After"Meeting notes written for you, with action items sent to Slack" | What changedSaid what the output is and where it goes. |
| Bookkeeping app for freelancers | Before"Finance, simplified" | After"Track income and expenses, and export a tax-ready report" | What changedDescribed the job, not the feeling. |
Vague copy is often promotional copy. In a 1997 test of five versions of the same site, reported by Jakob Nielsen, measured usability was 27% better with objective language than with promotional writing, 58% better with a concise version and 124% better when concise, scannable and objective were combined.[4] It is one old study, but it is a controlled one, and it points the same way as everything else here.
Jargon is the other cause. NN/g's 2017 research with experts in science, technology and medicine found that even highly educated readers want succinct, scannable information, and warns that jargon is "often meaningless and sounds pretentious" unless it names a concept your specialist audience already uses.[11] So keep "Postgres" if you sell to engineers. Drop "synergy" for everyone.
How do you score your own page in 30 minutes?
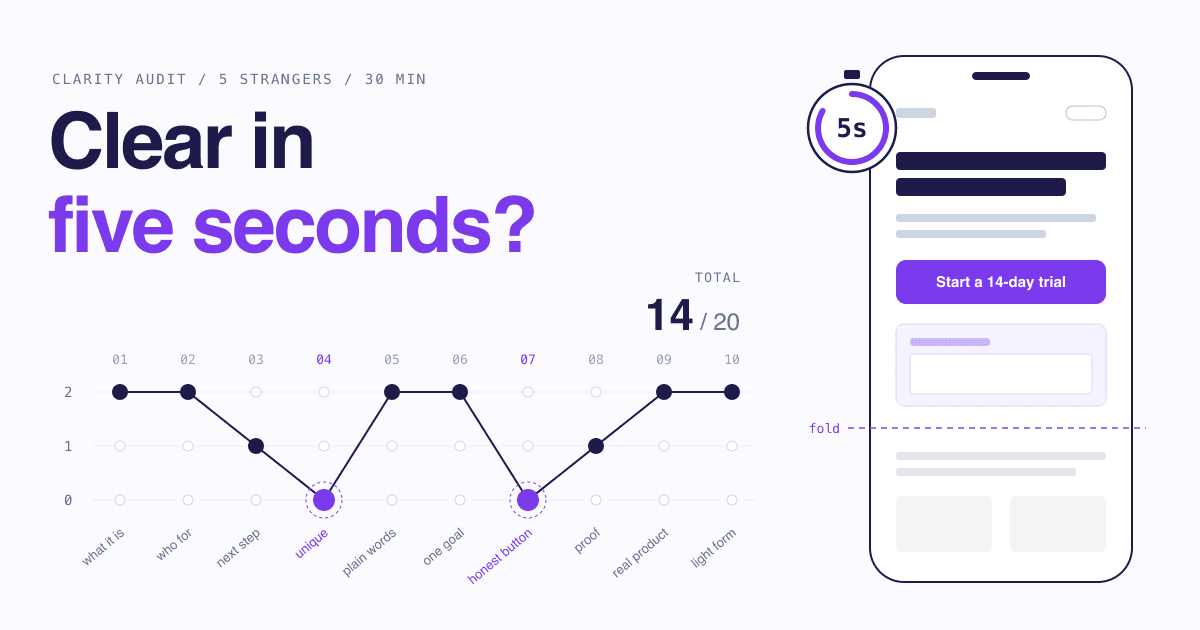
Capture the first screen, run a 5-second test on five people, then score ten criteria from 0 to 2 using what they said. The total out of 20 is your baseline.
The 30-minute audit
Minutes 0-5
Capture
Screenshot the first screen only, once on a laptop and once on a phone. Do not scroll, do not crop.
Minutes 5-20
Test
Run the 5-second test below on five people who have never seen the page. About three minutes each.
Minutes 20-27
Score
Fill in the rubric. Where a criterion has a tester answer, use that and ignore your own view.
Minutes 27-30
Pick
Choose the three lowest scores that sit in the first screen. Those are your next changes.
Figure 4Clarity scoring rubric: 10 criteria, each scored 0 (fail), 1 (partly) or 2 (pass)
| Criterion | What "pass" looks like | How to test it |
|---|---|---|
| 1. What it is | What "pass" looks likeAt least 4 of 5 testers name the product category correctly. | How to test it5-second test, question 1. |
| 2. Who it is for | What "pass" looks likeAt least 4 of 5 name the intended audience. | How to test it5-second test, question 2. |
| 3. Next step | What "pass" looks likeAt least 4 of 5 say what they would click and what they expect to happen. | How to test it5-second test, question 3. |
| 4. Uniqueness | What "pass" looks likeThe headline would be false or odd on a competitor's page. | How to test itPaste it under a competitor's logo and read it aloud. |
| 5. Plain words | What "pass" looks likeNo term in the first screen needs explaining to your audience. | How to test itAsk testers to circle any word they would not use themselves. |
| 6. One goal | What "pass" looks likeOne primary button style, pointing at one action, repeated down the page. | How to test itCount distinct primary actions. More than one scores 0. |
| 7. Honest button | What "pass" looks likeThe label names the outcome of the click. | How to test itCover the page and read only the button. Is the next screen predictable? |
| 8. Visible proof | What "pass" looks likeOne checkable piece of proof appears before scrolling. | How to test itLook at the phone screenshot, not the desktop one. |
| 9. Real product | What "pass" looks likeA legible view of the actual product is in the first two screens. | How to test itCan a tester describe one thing the product does from the image alone? |
| 10. Light form | What "pass" looks likeThe first form asks only for what the next step needs. | How to test itFor each field, name the step that breaks without it. No answer, no field. |
Clarity audit checklist
0 of 11 done
Prepare
First screen
Rest of the page
After the test
How do you run a 5-second test and a 5-user hallway test?
The 5-second test checks the first impression with a screenshot; the 5-user hallway test checks whether people can actually complete the primary action on the live page. Run them in that order.
How to run a 5-second test on your landing page
Recruit five people outside the project5 min
Not co-founders, not investors, not anyone who has heard the pitch. People close to your target audience are best; strangers in a relevant community are fine.
Show the first-screen screenshot for five seconds5 s each
Use a timer. NN/g advises against warning participants that the design will only be shown briefly, so they do not start over-analysing it.[8] Say only: "I will show you a page, then ask a few questions."
Hide it and ask three open questions2 min each
In this order: "What does this company or product do?", "Who do you think it is for?", "What would you do next on that page?" Do not prompt, nod or correct.
Write down their exact words1 min each
The words people use for your product are raw material for the next headline. A paraphrase in your own vocabulary throws that away.
Score rubric criteria 1 to 33 min
Count how many of the five got each answer right. Four or five is a 2, three is a 1, two or fewer is a 0.
Change one thing and retest with new peopleNext session
Anyone who has seen the page once is no longer a first-time visitor. Each round needs fresh participants.
Know what this test cannot do. NN/g notes that five seconds "is too short for reading copy or noticing details", so it tells you whether the headline, hierarchy and visual land, not whether your second paragraph persuades.[8] The five-second duration is a convention: the method is credited to Christine Perfetti in the mid-2000s, and a 2023 case study by UXtweak researchers, published in Smashing Magazine, found that fewer participants misjudged what a site was for at ten seconds than at five, and that visually complex screenshots drew better answers at ten.[13] If your first screen is dense, try ten seconds, then ask why it is dense.
For the hallway test, open the live page and give one task: "You heard about this from a friend. Find out what it costs and sign up." Then stay silent and watch. Five people at about ten minutes each is an hour. Note every hesitation, wrong click and question.
Figure 5Share of usability problems found, by number of test users (calculated from Nielsen's formula, L = 31%)
1 user
31%2 users
52.4%3 users
67.1%4 users
77.3%5 usersThe article rounds this to 85%
84.4%10 users
97.6%15 users
99.6%
What "test with 5 users" does and does not say
- It is an average, not a guarantee. The 31% figure is "averaged across a large number of projects". Your page may be easier or harder to break.[6]
- It assumes similar users. The formula "only holds for comparable users who will be using the site in fairly similar ways". With two distinct audiences, Nielsen suggests 3 to 4 users from each.[6]
- The real advice is to repeat. Nielsen's recommendation is three studies of five users each, fixing between rounds, over one study of fifteen.[6]
- It is qualitative. For numbers you can quote, his 2012 follow-up says to test at least 20 users. "5 of 5 understood it" is a signal, not a statistic.[7]
- It was about usability problems. The research counted problems found in task-based tests. Applying five people to a 5-second impression test borrows the sample size, not the proof.
How much do a second goal and a long form cost you?
Each one adds a decision or a chore between the visitor and the action. You cannot know the exact cost without testing, but you can remove both cheaply.
One page, one goal. If the page asks for a trial, a demo booking, a newsletter signup and a community join at equal weight, the 5-second answer to "what would you do next?" will be scattered, and criterion 6 scores 0. Keep secondary paths, but demote them to text links below the primary action.
On forms, NN/g's first recommendation is to keep them short: "Every time you cut a field or question from a form, you increase its conversion rate".[12] Treat that as a strong prior from practitioners, not a law. The same article cites a 2014 study in which forms following basic usability guidelines were submitted with no errors on the first try 78% of the time, against 42% for forms that violated them.[12] Its other rules are quick to apply: one column, visible labels instead of placeholder text, and at most 1 or 2 optional fields, clearly marked.[12]
What is a clearer page worth? (arithmetic only)
Enter your own traffic, your current signup rate and a rate you want to compare it with. Move the second rate slider to see how the monthly totals change.
- Signups per month at today's rate
- 40
- Signups per month at the comparison rate
- 60
- Monthly value at today's rate
- $2,000
- Monthly value at the comparison rate
- $3,000
This is multiplication, not a forecast. The default numbers are placeholders, not benchmarks, and nothing here predicts that a clearer page will reach the comparison rate. Use it to decide how much time the audit deserves at your traffic level.
The calculator makes one point honestly: at low traffic, the gap between the two rates is small in absolute terms, and you will not be able to measure it. With a few hundred visitors a month, rely on the tests in this guide instead of waiting for a conversion number to move. Page speed also shapes the first seconds, and has its own guide on Core Web Vitals for startup websites.
Which fix matches which symptom?
Match the fix to what testers actually said or did. Most failures in the first screen are copy problems, and copy is the cheapest thing on the page to change.
If the test shows this, change that
If Testers describe a different kind of product
Rewrite the headline with the formula above so it names the category. Do not touch the design yet.
If They get the product right but not the audience
Put the audience in the subhead, and make the product visual show that audience's data or use case.
If They cannot say what they would do next
Reduce to one primary button, give it a contrasting style and an outcome label, and demote the rest to links.
If They repeat a buzzword back with no idea what it means
Swap it for the phrase a tester used when they did understand. Their words beat yours.
If In the hallway test they scroll up and down looking for the price
Add a visible pricing link or a one-line price statement near the primary action.
If They start the form and stop
Ask which field made them pause, then remove it or explain why you need it.
A clear headline pays off outside your own site too. Anywhere your product is listed, you get one short line to describe it. On SitePatent, for example, a listing has a tagline of up to 100 characters, and the headline that survives a 5-second test is usually the right starting point for it. Browsing other listings is also a quick way to see how much or how little a single line can say.
What mistakes make a clarity audit worthless?
Testing people who already know the product, leading them towards the answer, and changing five things between rounds. Each one produces a comfortable result that tells you nothing.
Six ways to waste the 30 minutes
- Avoid: Testing friends who have heard the pitch. They fill the gaps from memory. Their "I get it" is about you, not the page.
- Avoid: Warning them it will be fast. People told to expect five seconds try to memorise instead of react.[8]
- Avoid: Asking "is this clear?" People say yes to be polite. Ask them to tell you what it is; clarity shows in the answer.
- Avoid: Reusing participants. A second look is not a first impression. New round, new people.
- Avoid: Changing everything at once. If the score rises you will not know why, and if it falls you cannot undo the right thing.
- Avoid: Quoting the result as a statistic. Five people give you direction. "80% of users understood our page" from a sample of five is not a claim to publish.[7]
There is also a time not to run this audit: before you know who the product is for. If you cannot fill in the audience bracket of the headline formula, the problem is positioning, and no rubric will find it. Talk to customers first, then come back.
Nor does a clear page create demand on its own. It makes the visits you already earn count for more. Once the first screen scores 16 or better, the next question is where those visits come from, which the guide on where to promote your startup covers, along with an audited list of startup directories.
5 quick answers
Common questions
Short answers to the follow-up questions readers ask most.
Not here? Ask usAsk in communities where your audience already gathers, trade tests with other founders, or ask people at a co-working space or meetup. The only hard requirement is that they have never seen the page or heard your pitch. People near your target audience give better answers on wording, but for the basic question of what the product is, almost any outsider beats a teammate.
Sources
- [1]How Long Do Users Stay on Web Pages?Nielsen Norman Group, 2011
- [2]How Little Do Users Read?Nielsen Norman Group, 2008
- [3]Scrolling and AttentionNielsen Norman Group, 2018
- [4]How Users Read on the WebNielsen Norman Group, 1997
- [5]F-Shaped Pattern of Reading on the Web: Misunderstood, But Still Relevant (Even on Mobile)Nielsen Norman Group, 2017
- [6]Why You Only Need to Test with 5 UsersNielsen Norman Group, 2000
- [7]How Many Test Users in a Usability Study?Nielsen Norman Group, 2012
- [8]Testing Visual Design: A Comprehensive GuideNielsen Norman Group, 2024
- [9]Top 10 Guidelines for Homepage UsabilityNielsen Norman Group, 2002
- [10]"Get Started" Stops UsersNielsen Norman Group, 2017
- [11]Plain Language Is for Everyone, Even ExpertsNielsen Norman Group, 2017
- [12]Website Forms Usability: Top 10 RecommendationsNielsen Norman Group, 2016
- [13]Five-Second Testing: Taking A Closer Look At First Impressions (Case Study)Smashing Magazine, 2023
- [14]The Joel Test: 12 Steps to Better CodeJoel on Software, 2000
How this guide was put together. Every figure and quotation on this page was checked against the text of the cited article on October 11, 2026 and is reported with the year of the original study; several are more than a decade old and were measured on desktop screens, so they show direction, not current benchmarks for your audience. The bar chart is our own calculation from the formula and average published in the cited article, not a copy of its figures. The above-the-fold contract, the rubric and its scoring bands, the headline formula and the decision rules are editorial judgement, and all example products and copy are invented.